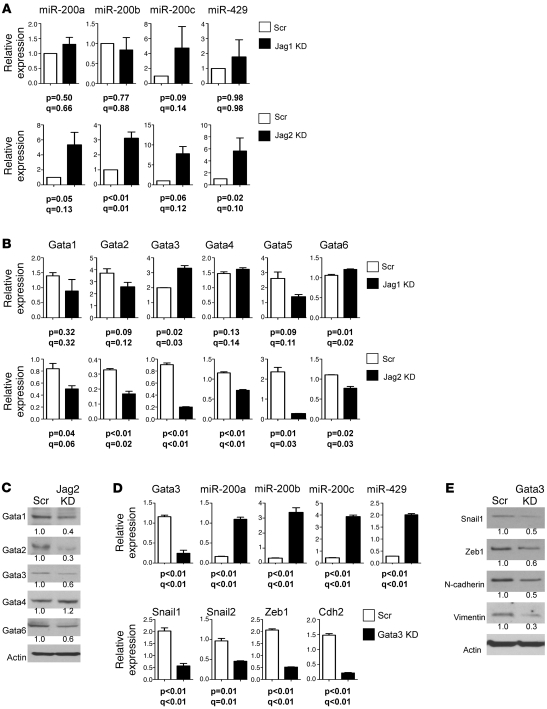
Figure 5. Jagged2 promotes EMT by inhibiting miR-200.
(A and B) Quantitative PCR analysis of (A) miR-200 and (B) Gata family members in Jagged1-depleted, Jagged2-depleted, and control shRNA transfectants. Values represent the mean (± SD) of replicate (triplicate) samples. Q values estimate the fraction of comparisons with the given nominally significant P value (2-tailed welch’s t test) that may arise from multiple testing. (C) Western blotting of GATA family members in Jagged2-depleted and control 344SQ transfectants. Densitometric quantification of bands indicated under each gel is expressed relative to that of control, which was set at 1.0. (D) Quantitative PCR analysis of Gata3, miR-200 family members, and EMT-related genes in Gata3-depleted and control shRNA transfectants. Values represent the mean (± SD) of replicate (triplicate) samples. (E) Western blotting of Snail1, Zeb1, Cdh2, Vim, and Actin in control and Gata3-depleted cells. Actin indicates relative protein loading. (C and E) Protein band density was quantified by densitometry, normalized to that of control cells (which is set at 1.0), and is indicated below each blot.

