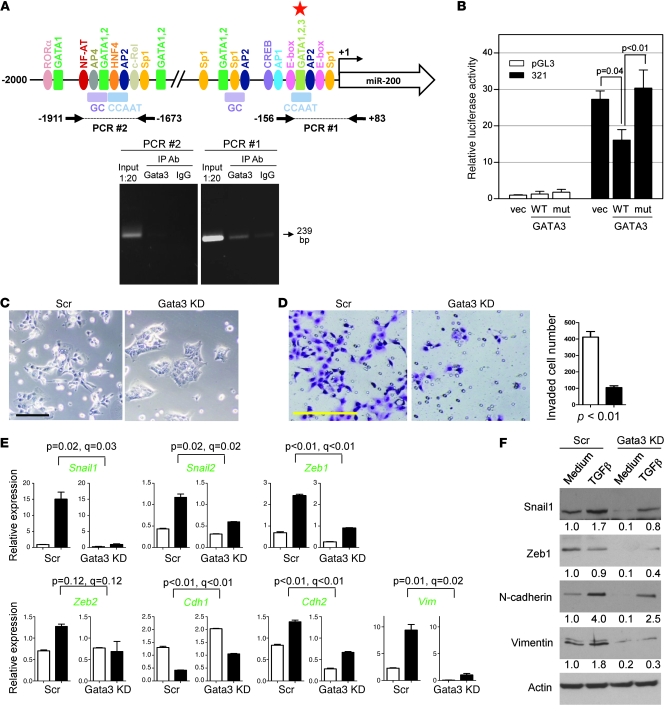
Figure 6. Gata3 directly suppresses miR-200 transcription and induces EMT.
(A) ChIP assays examined Gata3 binding to the miR-200b promoter in human H322 lung cancer cells. A 239-bp PCR product (arrow) was generated from the Gata3 IP samples (Gata3), using primers for a proximal promoter segment (PCR #1), but not from upstream regulatory sequences (PCR #2), which are illustrated graphically above the gel. Putative binding sites for GATA3 (red star) and other transcription factors (colored ovals and rectangles) predicted by TRANSFAC (BIOBASE Biological Databases). (B) MCF-7 cells cotransfected with reporters containing the proximal miR-200 promoter (–321 to +15 bp from the transcription start site) or empty luciferase vector (pGL3) and vectors containing Gata3 (WT), inactive Gata3 mutant (mut), or empty vector (vec). Values were expressed as the mean (± SD) of triplicate wells. The differences between groups were estimated by 1-way ANOVA (P < 0.01). (C) Images of Gata3-depleted or control 344SQ transfectants. Scale bar: 100 μm. (D) Images of invaded Gata3-depleted (black bar) and control (white bar) 344SQ transfectants, which were counted and expressed as the mean values (± SD) of replicate (triplicate) wells (bar graph). Scale bar: 100 μm. (E) Quantitative RT-PCR analysis of the indicated genes (green) in Gata3-depleted and control shRNA transfectants treated for 48 hours with (black bars) or without (white bars) TGF-β (1 ng/ml). Values represent the mean (± SD) of triplicate samples. (F) Western blotting of control and Gata3-depleted cells treated with medium or TGF-β (1 ng/ml) for 48 hours. Band density was quantified by densitometry, normalized to that of medium-treated control cells (which are set at 1.0), and is indicated below each blot.

