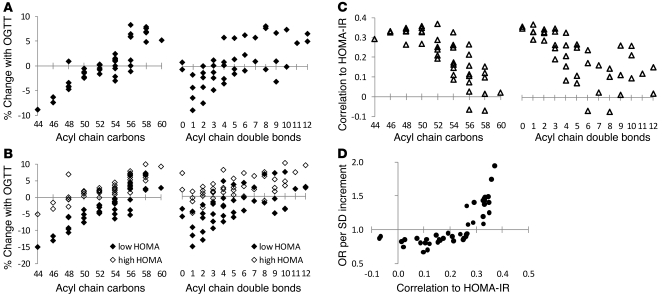
Figure 5. TAGs and insulin action in FHS.
(A) The mean percentage of change of each TAG in response to OGTT. (B) The mean percentage of change of each TAG in response to OGTT for individuals in the lowest (black diamonds) and highest (white diamonds) quartiles of HOMA-IR. (C) Spearman correlation coefficient for each TAG with HOMA-IR. For A–C, each data point represents a distinct TAG, organized along the x axis based on total acyl chain carbon number (left) or double bond content (right). (D) The risk of diabetes for each TAG following multivariable adjustment and correlation with HOMA-IR.

