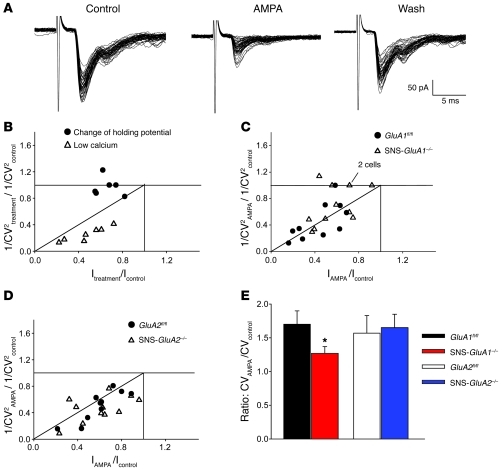
Figure 2. Patch clamp analysis of AMPA-induced modulation of synaptic transmission between primary afferents and spinal dorsal horn neurons in SNS-GluA1–/– and SNS-GluA2–/– mice and their control littermates, GluA1fl/fl and GluA2fl/fl mice.
(A) Glutamatergic EPSCs recorded from a lamina II neuron obtained from a wild-type mouse. Application of AMPA (250 nM) caused a depression of EPSC, an increase of amplitude variability, and the appearance of some failures, which were reversed upon washing AMPA out. (B–D) Plot data showing the ratio of CV-2 as a function of relative EPSC amplitude. Each symbol represents 1 neuron. (B) Graph representing CV changes in control experiments (low extracellular calcium and change of holding potential) mimicking presynaptic and postsynaptic modulations, respectively. 1/CV2treatment/1/CV2control represents the ratio between 1/coefficient of variation squared, obtained during treatment (either 1mM extracellular calcium or holding potential = –55 mV), and 1/coefficient of variation squared, measured in control (i.e., 2 mM extracellular calcium or holding potential = –85 mV). Itreatment/Icontrol represents the ratio between mean EPSC amplitude, measured during treatment (see above), and mean EPSC amplitude measured in control. (C and D) Effects of AMPA on EPSC amplitudes and CV values in wild-type, GluA1fl/fl, and SNS-GluA1–/– mutant mice. A subpopulation of neurons from SNS-GluA1–/– mice exhibited a pure postsynaptic modulation, since the CV remained constant in AMPA. 1/CV2AMPA/1/CV2control represents the ratio between 1/coefficient of variation squared, obtained during application of AMPA250 nM and 1/coefficient of variation squared, measured in control. IAMPA/Icontrol represents the ratio between mean EPSC amplitude, measured during AMPA application, and mean EPSC amplitude measured in control. (E) The ratio of CV in AMPA to CV in control is significantly lower in SNS-GluA1–/– mice, as compared with that in GluA1fl/fl mice (*P < 0.05, t test).

