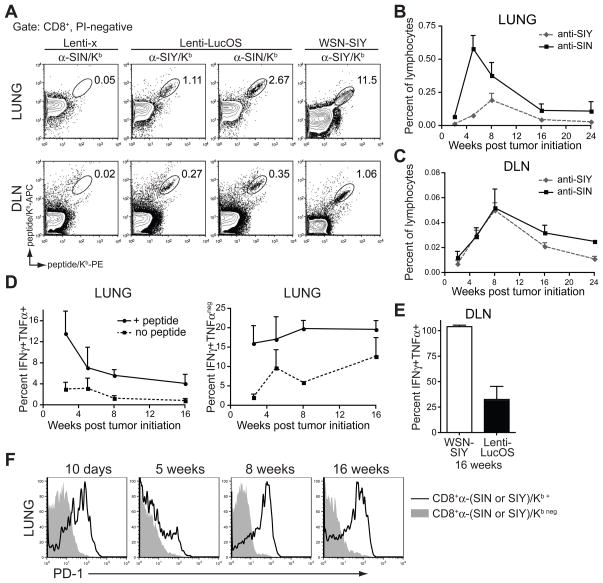
Figure 2. T cell responses to tumor antigens are generated but not sustained.
(A) Representative analysis of SIY and SIN specific CD8+ T cells in the lung and the draining mediastinal lymph node (DLN) of Lenti-x or Lenti-LucOS tumor-bearing mice or WSN-SIY infected mice using peptide-loaded Kb reagents. FACS plots are gated on PI-negative, CD8+ cells.
(B and C) Percent of lymphocytes specific for SIN or SIY during Lenti-LucOS tumor progression in the lung or DLN. The percent of anti-SIN or anti-SIY reactive cells (of total lymphocytes) was determined as shown in Figure S2A. n= 2–5 mice per time-point.
(D) IFNγ and TNFα cytokine production in SIY and SIN-reactive T cells from the lungs of Lenti-LucOS tumor-bearing mice at several time points after tumor initiation. The percentage of SIY and SIN-specific T cells from the lungs that were IFN-γ+TNF-α+ or IFN-γ+TNF-αneg in the absence (no peptide) or in the presence of SIY and SIN peptides (+ peptide) is shown. Percentages were determined by staining duplicate samples for either DimerX or cytokine production as described in Figure S2L. n= 2–7 mice per time-point.
(E) The percentage of SIY and SIN-specific T cells in the DLN that were IFN-γ+TNF-α+ 16 weeks after tumor initiation with Lenti-LucOS or WSN-SIY infection. n= 4 mice per group.
(F) PD-1 surface expression on anti-SIY/Kb+ and anti-SIN/Kb+ CD8+ cells (open histograms) or non-specific CD8+ cells (filled histograms) from the lungs of Lenti-LucOS tumor-bearing mice at several time-points after tumor initiation. n= 2–3 mice per group.
Data are mean ± SEM. See also Figure S2.

