
Figure 2.
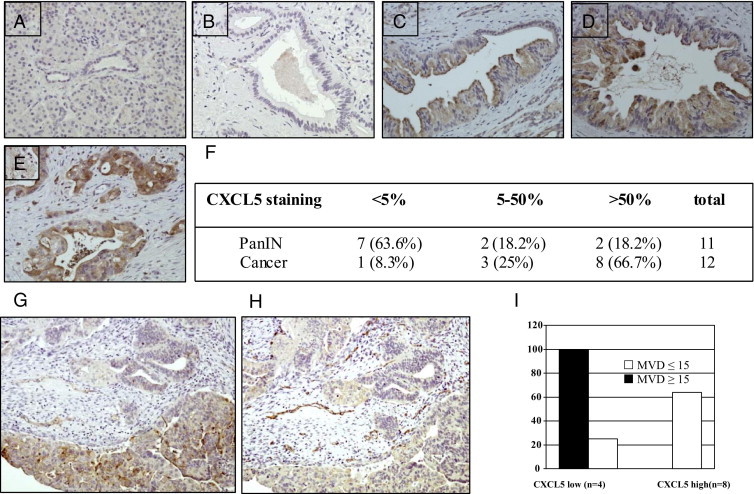
Correlations between CXCL5 expression and tumor progression and MVD. A: Normal human pancreas. B: PanIN-1. C: PanIN-2. D: PanIN-3. E: Invasive carcinoma. Original magnification, ×200. F: CXCL5 staining in PanIN lesions and cancer (P = 0.03). Tumor tissues stained with CXCL5 (G) and CD31 (H) were divided into CXCL5 low (≤50%) and CXCL5 high (>50%) groups (I). The MVD was subdivided into two groups (≤15 and >15). P = 0.03 by χ2 test.