
Figure 3.
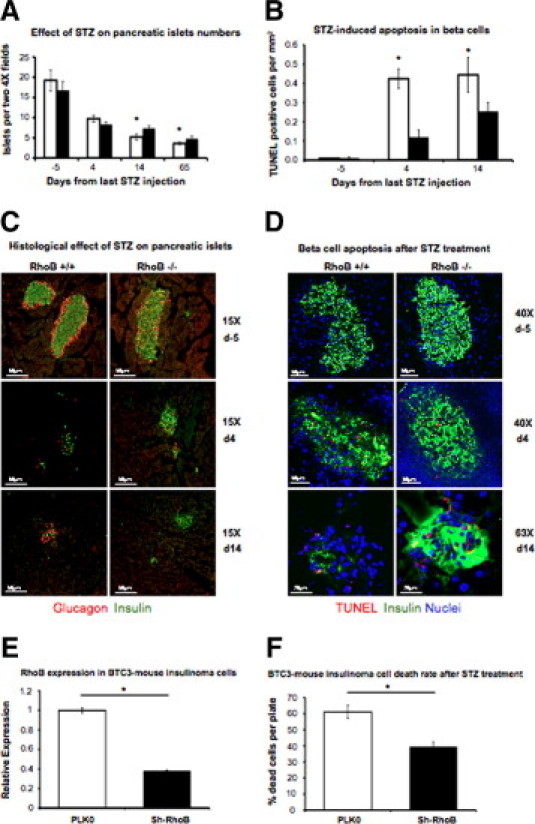
A: Effect of STZ on the number of pancreatic islets. In both strains, the number of pancreatic islets decreased 4, 14, and 65 days after the last STZ injection, but the number of islets is significantly higher in RhoB−/− (black bars) pancreas than in the RhoB+/+ (white bars) at days 14 and 65. Values are mean ± SE. The SE (n = 5 to 8) is shown as the error bar. *P < 0.05 for RhoB+/+ versus RhoB−/−. B: Quantitative analysis of apoptotic β cells in the pancreas after STZ treatment shows that 4 and 14 days after the last STZ injection, RhoB−/− mice have significantly fewer TUNEL-positive β cells than RhoB+/+ mice. Values are the mean ± SE. The SE (n = 5 to 8) is shown as the error bar. *P < 0.05 for RhoB+/+ versus RhoB−/−. C: Immunohistochemistry labeling of pancreatic β cells (insulin in green and glucagon in red). For both, RhoB+/+ and RhoB−/− show STZ-induced β-cell depletion and decrease in size and number of pancreatic islets. Still, the effect is more dramatic in RhoB+/+, in which, after 14 days of the last STZ injection, the ratio of insulin-producing cells/glucagon-producing cells decreased significantly while insulin-producing islets can still be found in RhoB−/− sections. D: Immunohistochemistry labeling of pancreatic β cells (insulin in green, TUNEL positive in red, and nuclei in blue). E:RhoB expression measured by RT-PCR in mouse insulinoma βTC3 cells. The white bar is the expression of cells infected with empty plasmid. The black bar represents RhoB expression after the cells have been infected with shRNA to knock down RhoB. The expression level decreased 60%. Values are the mean ± SE. The SE is shown as the error bar. PLK0, n = 5; and sh-RhoB, n = 5. *P < 0.01 for PLK0 versus sh-RhoB. F: Knocking down RhoB in βTC3 cells significantly reduced their sensitivity to STZ-induced cell death. Values are the mean ± SE. The SE is shown as the error bar. PLK0, n = 5; and sh-RhoB, n = 5. *P < 0.01 for PLK0 versus sh-RhoB.