
Figure 3.
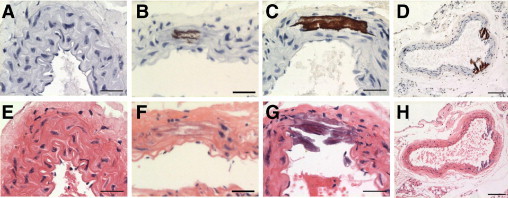
Representative histochemical micrographs of von Kossa staining for baseline (A), week 8 (B), week 12 (C), and week 16 (D) time points, with corresponding H&E-stained slides from adjacent sections (E–H). All sections were of the abdominal aorta region, and nuclei were counterstained with Harris hematoxylin. Scale bars = 30 μm throughout, except scale bar = 100 μm for D and H.