
Figure 4.
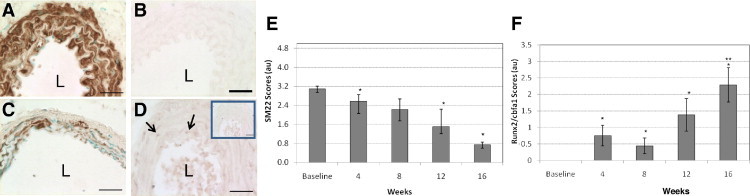
Representative micrographs of immunohistochemical staining. Baseline staining of SM22α (A) and Runx2/Cbfa1 (B), week 16 staining of SM22α (C), and week 4 staining of Runx2/Cbfa1 (D), arrows indicate positively stained nuclei. L, lumen. Inset shows nonspecific IgG staining as a control. All sections were of the abdominal aorta region, and SM22α nuclei were counterstained with methyl green. Scale bars = 30 μm. Immunohistochemistry scores for SM22α (E) and Runx2/Cbfa1 (F) were determined as described in the Materials and Methods section. Data are reported as means ± SEM. *P < 0.05, compared with baseline. **P < 0.05, compared with week 4 and week 8.