
Figure 8.
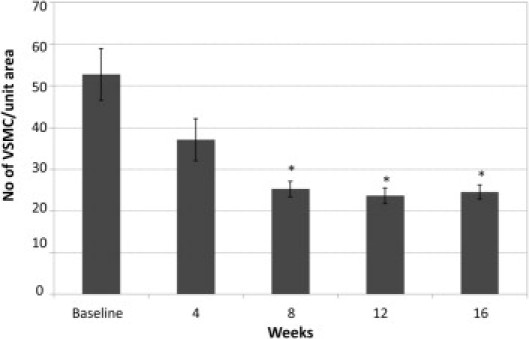
Vascular smooth muscle cell loss in CKD. Comparison of number of VSMC/unit area at baseline (n = 7) and at week 4 (n = 8), week 8 (n = 6), week 12 (n = 9), and week 16 (n = 8). Data are reported as means ± SEM. *P < 0.05, compared with baseline.