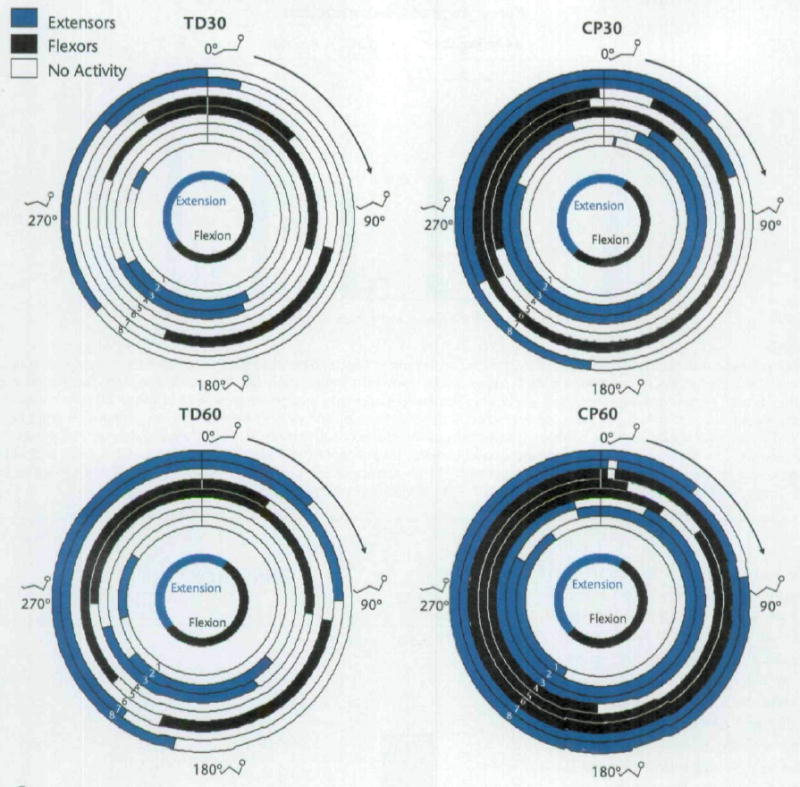
Figure 5.

Polar plots of mean onsets and offsets of muscle activity of the left lower extremity for all subjects. Zero degrees occurred when the left crank arm was horizontal and farthest from the subject (Fig. 2). Muscles other than the gluteus maximus were labeled as primary extensors and flexors based on their actions at the knee and at the ankle. The duration of activity may differ from those shown in Table 3 because the durations here represent the difference between mean onset and mean offset. From these plots, the relationship of activity of muscles, including co-contraction, can be seen. The innermost circle represents when hip flexion and extension occurred in order to identify the phase. The stick figures show the approximate position of the lower extremities at that point in the revolution, and the arrow indicates forward movement of the crank when viewed from the right side of the cycle. 1=gluteus maximus muscle, 2=rectus femoris muscle, 3=vastus lateralis muscle, 4=medial hamstring muscle, 5=biceps femoris muscle, 6=anterior tibialis muscle, 7=lateral gastrocnemius muscle, 8=soleus muscle. TD30=subjects with typical development (TD) at cadence of 30 rpm, CP30=subjects with cerebral palsy (CP) at cadence of 30 rpm, TD60=subjects with TD at cadence of 60 rpm, CP60=subjects with CP at cadence of 60 rpm.
