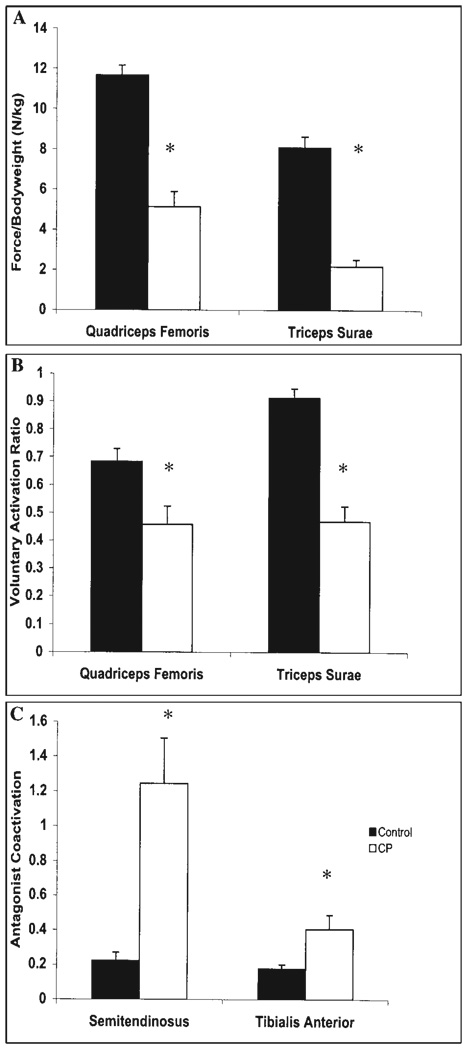
FIGURE 1.
(A) Maximum voluntary isometric contraction (MVIC) force normalized to body weight (kg) for the quadriceps femoris and triceps surae in CP (n = 12) and control (n = 10 for quadriceps, n = 8 for triceps surae) groups. (B) The degree of voluntary muscle activation in the quadriceps femoris and triceps surae in CP and control groups. (C) The degree of antagonist coactivation of the semitendinosus and tibialis anterior during MVICs of the quadriceps femoris and triceps surae, respectively, in CP and control groups. *Represents a difference between CP and control groups where P < 0.05.

