
Figure 2.
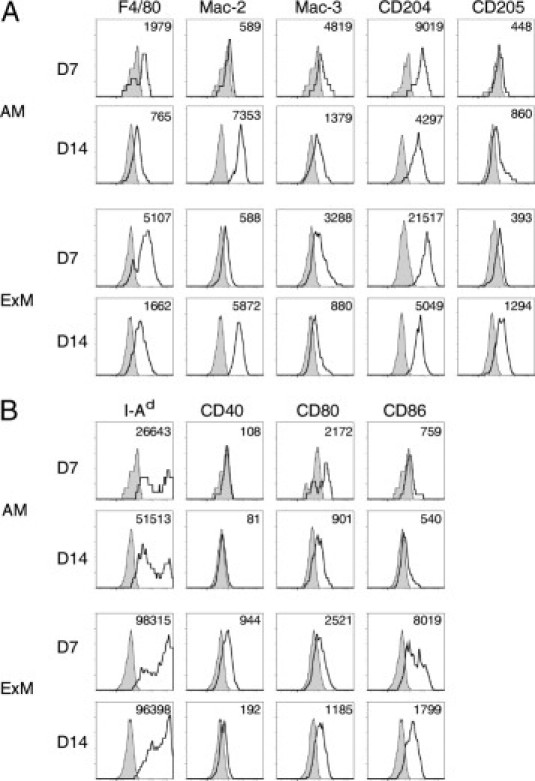
Cell surface phenotype of AMs and ExMs in the lungs of mice infected with C. neoformans. Lung leukocytes obtained from wild-type mice at 7 and 14 dpi with C. neoformans were identified using the gating strategy described in the legend to Figure 1. Representative histograms (four-decade log scale) of AMs or ExMs from individual mice displaying their expression of macrophage-associated proteins (F4/80, Mac-2, Mac-3, CD204, and CD205) (A) and MHC class II (I-Ad) and costimulatory molecules (CD40, CD80, and CD86) (B). Shaded histogram, isotype staining; open histogram, specific staining. Numbers located above the histograms represent the change in mean fluorescent intensity (MFI) between specific antibody and isotype staining. The experiment was performed three times with similar results.