
Figure 3.
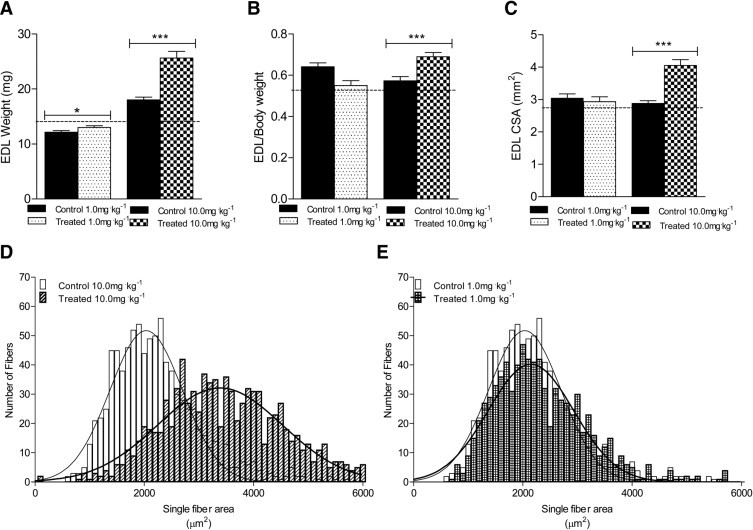
Effects of sActRIIB therapy on EDL weight and CSA in control mdx mice and in mdx mice treated with 1.0 mg/kg−1 or 10.0 mg/kg−1 sActRIIB. Significant increases were observed at both doses in absolute EDL weight (A) and at the higher dose in normalized EDL weight (B), and EDL whole-muscle cross-sectional area (CSA) (C). The dashed line (A–C)indicates values for untreated, age-matched wild-type BL/10 mice. D and E: Histograms from single-fiber CSA analysis reveal a shift to the right for the higher dose (D). *P < 0.05; ***P < 0.001.