Figure 2.
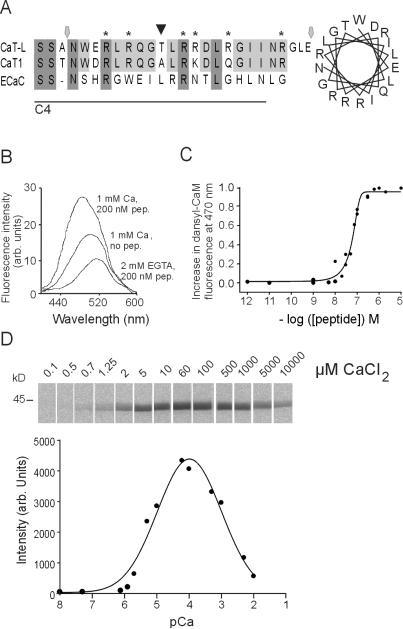
Properties of CaT-L's CaM binding site. (A) Sequence of the CaM binding site and corresponding regions of CaT1 (no. AAD47636) and ECaC (no. CAB40138). Line shows C4 fusion protein, hexagonal markers indicate peptide 395, and arrow points to a PKC phosphorylation site in CaT-L. Helical wheel representation of the CaM binding site (Right). (B) Dansyl-CaM fluorescence spectra in the absence or presence of 200 nM CaT-L peptide 395 at 1 mM Ca2+ or 2 mM EGTA. (C) Fluorescence as a function of free peptide concentration. Data points show the average of two to four experiments and the apparent Kd was 65 nM. (D) Overlay blot of GST-CaT-L C1 protein incubated with [35S]CaM at different [Ca2+] (Upper) with the mean amount of bound CaM measured by densiometric analyses as a function of free [Ca2+] (n = 4; Lower).

