
Figure 2.
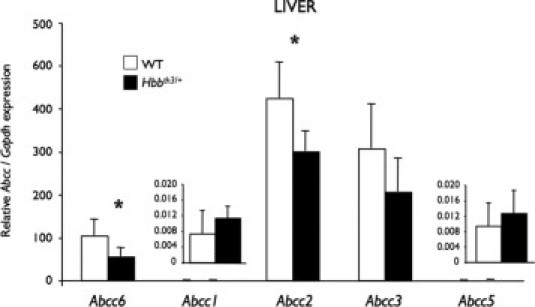
Comparison of expression levels of Abcc1, Abcc2, Abcc3, Abcc5, and Abcc6 in the liver of 10-month-old wild-type (WT) and β-thalassemia mouse model (Hbbth3/+) mice. Total RNA was prepared from mouse liver of WT and Hbbth3/+ mice (as described in the Materials and Methods section) and reversed transcribed. Quantitative PCRs were performed using TaqMan probes (Applied Biosystems, Foster City, CA) specific to mouse Abcc1, Abcc2, Abcc3, Abcc5, Abcc6, and Gapdh cDNA. Units represent mRNA levels relative to the WT Abcc6 expression level. Standard errors are shown. *P < 0.05.