
Figure 4.
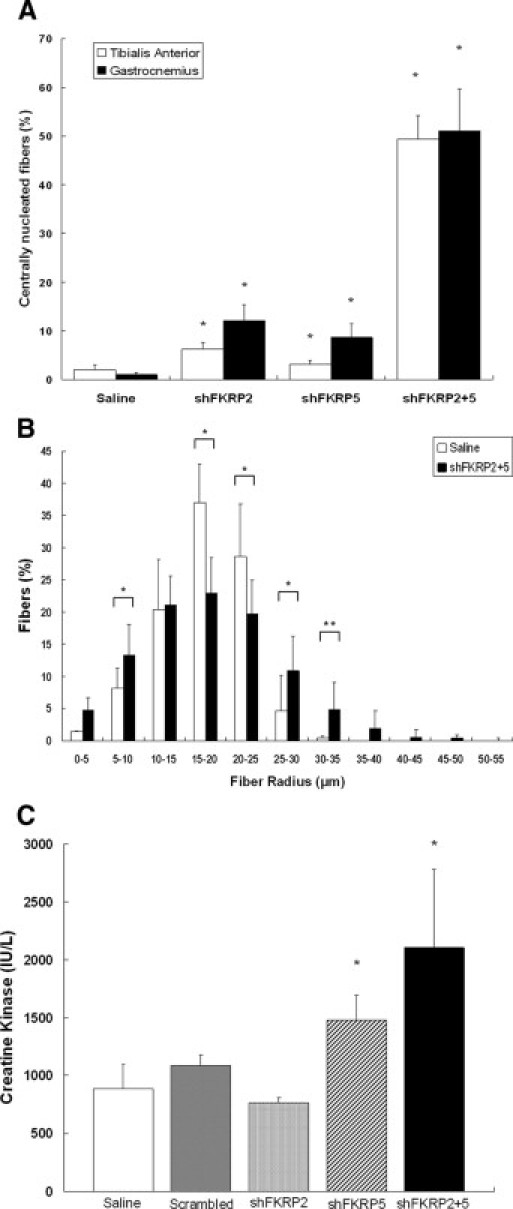
Quantification of the muscle fibers' pathology and morphology. A:. The numbers of centrally nucleated fibers in AAV-shFKRP-treated TA and GAS muscles were counted in five random fields of view under the microscope. In both TA and GAS muscles, not only the single-cassette groups treated with shFKRP2 (6.3% ± 1.4% and 12.1% ± 3.3%) and shFKRP5 (3.1% ± 0.9% and 8.7% ± 2.8%), but also the dual-cassette group treated with shFKRP2 + 5 (49.4% ± 4.9% and 51.1% ± 8.5%) showed centrally nuclear myopathy that was significantly different from that of the control group (2.0% ± 1.05% and 1.01% ± 0.48%, n = 5, mean ± SD, *P < 0.001). B: The radius of individual GAS myofibers in each treatment group was measured and evaluated by MetaMorph software. Note that the shFKRP2 + 5–treated GAS muscles (black column) displayed more variable and uneven distribution of myofiber radius than did the PBS-treated muscle (white column) (n = 5, mean ± SD, Student's t-test, *P < 0.001; **P < 0.05). C: The level of creatine kinase (CK) in each treatment group was analyzed. Note that compared with the control (884.1 ± 214.5 IU/L; white column), the levels of CK in shFKRP2 + 5–treated mice (2104 ± 675.7 UI/L; black column) and in shFKRP5 (1480.4 ± 214.4 IU/L; diagonal column) were significantly increased (n = 5, mean ± SD, *P < 0.001).