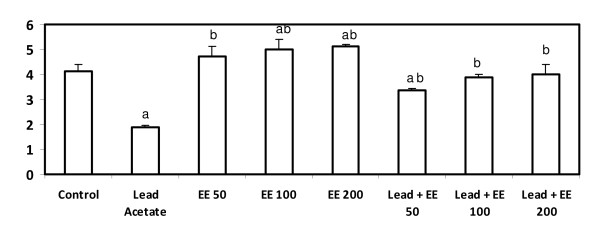
Figure 2.
Serum total antioxidants level (μmol/mg protein) in control and E. elatior alone or in combination with lead acetate-treated rats. Results are expressed as means ± S.D. of eight rats per group; EE - Etlingera elatior a - Significantly different from control - p < 0.05 b - Significantly different from lead alone treatment group - p < 0.05

