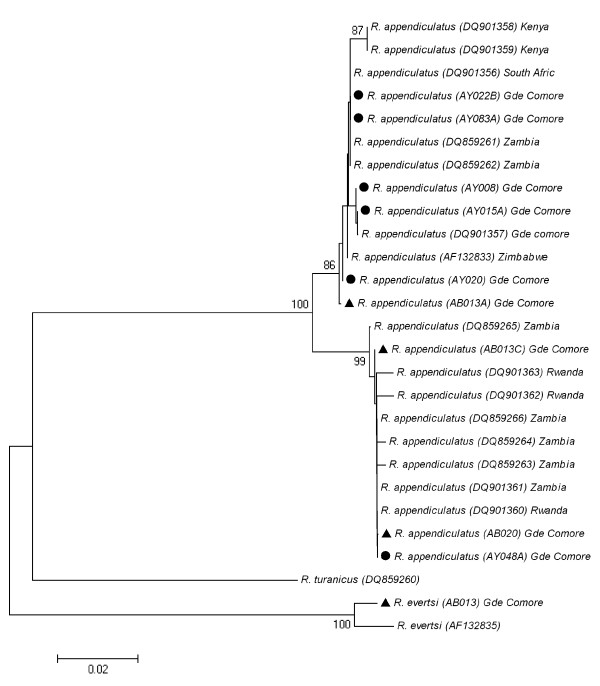
Figure 2.
Phylogenetic tree of R. appendiculatus. The evolutionary history was inferred using the Neighbor-Joining method [14]. New sequences provided by the present study are indicated by a black dot (ticks collected in farms) or a black triangle (ticks collected from imported cattle) in front of the sequence name (containing the accession number). The values above nodes correspond to bootstrap values, with only values superior to 80 indicated [20]. The tree is drawn to scale, with branch lengths in the same units as those of the evolutionary distances used to infer the phylogenetic tree. The evolutionary distances were computed using the Kimura 2-parameter method [15] and are in the units of the number of base substitutions per site. All positions containing missing data were eliminated only in pairwise sequence comparisons (Pairwise deletion option). There were a total of 793 positions in the final dataset. Phylogenetic analyses were conducted in MEGA4 [21].

