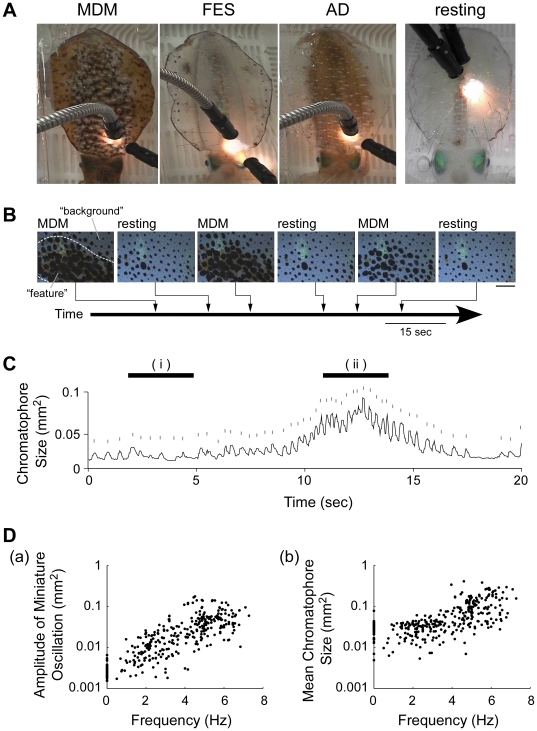
Figure 1. The expression of chromatic patterns and chromatophore behavior in semi-intact Sepioteuthis lessoniana.
A: Three chromatic patterns observed in this study: mottled dorsal mantle (MDM), fin edge spots (FES), and all dark (AD). Body color in the resting state is clear (resting). B: A typical time course of MDM pattern expressions. The pictures show a part of the dorsal mantle skin in which the MDM pattern appeared at different intensities and then disappeared (resting). The appearance time of each picture is indicated in the trace. The broken lines in the left picture indicate the boundary between feature and background areas. Scale bar: 1.5 mm. C: A temporal size profile of an individual chromatophore. Upper short lines above the each trace show the contribution of miniature oscillation to the expansions. Top lines indicate the 3.3 s periods during which the oscillation frequencies for smaller chromatophore size (i) and larger size (ii) were calculated. D: Relationship between oscillation frequency and amplitude of miniature oscillation (a) and between oscillation frequency and mean chromatophore size (b) during nine periods of 3.3 s. The amplitude of miniature oscillation indicates the maximum amplitude value in the expansion and retraction in each frame (See figure S1). The mean chromatophore size is the average value during the 3.3 s. A logarithmic scale was used on the Y-axis. Data were analyzed from 336 individual black chromatophores on a total of six areas from three animals.

