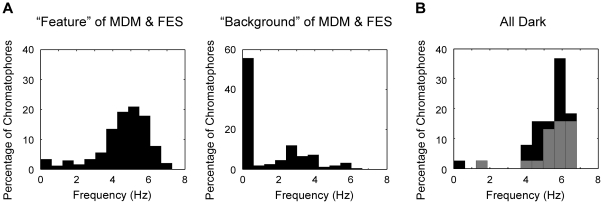
Figure 2. Oscillation frequencies of chromatophores.
A: Frequency histograms show the distribution of oscillation frequency in the feature areas (n = 230; 111 different chromatophores, 2 animals) and background areas (n = 147; 68 different chromatophores, 2 animals) for the MDM and FES patterns. B: Frequency distribution during the AD pattern for 38 of the same chromatophores represented in Fig. 2A (see text). The gray area indicates the percentage of chromatophores located in the MDM feature area, and the black area indicates chromatophores located in the background area.

