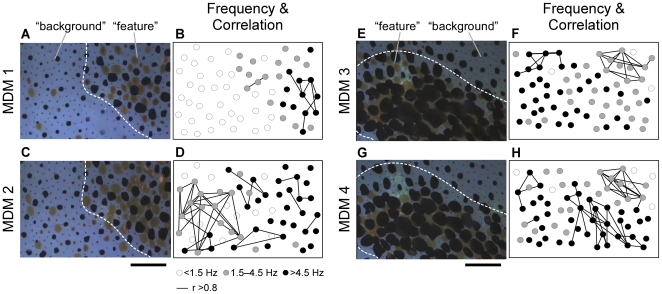
Figure 3. Spatial correlation maps of miniature oscillation during four chromatic pattern expressions.
Pictures on the left of each panel (A, C, E, and G) are parts of different MDM expressions. Movies of MDMs 1 and 2 and MDMs 3 and 4 were recorded in the same areas individually. Broken lines indicate the border between feature and background areas. Scale bar: 1.5 mm. Pictures on the right of each panel (B, D, F, and H) show the oscillation frequency in individual chromatophores and oscillatory synchrony among individual chromatophores in that expression. The circles indicate each chromatophore and the color of each circle indicates its oscillation frequency: white is <1.5 Hz, gray is 1.5–4.5 Hz, and black is >4.5 Hz. The pair of chromatophores connected by a line corresponds to highly correlated oscillatory behavior (correlation coefficient, r>0.8). (See video S1 for the expressed MDM 1 and video S2 for the expressed MDM 2.).

