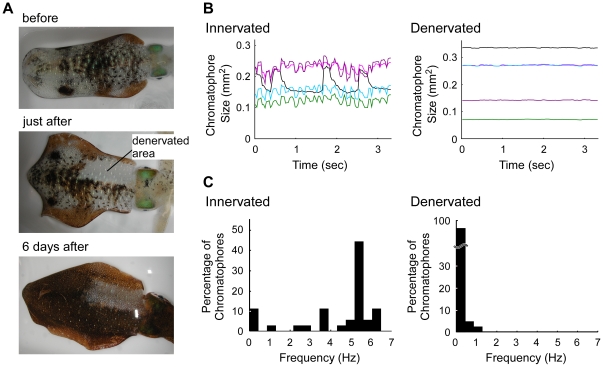
Figure 5. Behavior of chromatophores on innervated and denervated regions in semi-intact squid.
A: Images of dorsal mantle including normal and denervated regions before the operation (upper), immediately after recovery from the operation (middle), and 6 days later (lower). B: Temporal profile of expanded sizes of chromatophores in innervated and denervated regions 6 days after the operation. Each line represents individual chromatophores. C: Distribution of oscillation frequencies of chromatophores in the innervated area (36 chromatophores) and denervated area (43 chromatophores).

