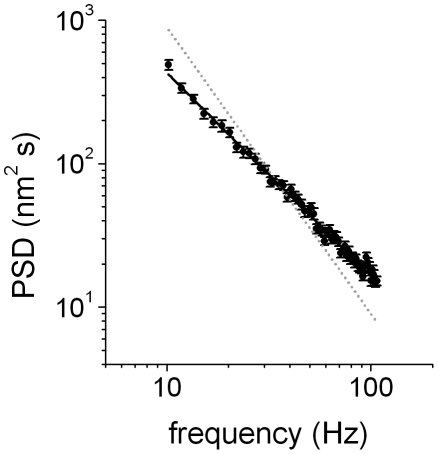
Figure 3. Power spectrum distribution of .
 . 260 trajectory segments obtained for dynein-driven organelles during dispersion were analyzed as described to obtain the PSD. The continuous line corresponds to the fitting of PSD = af−β with β = 1.41±0.02. Dotted gray line represents the behavior expected for a pure viscous microenvironment.

