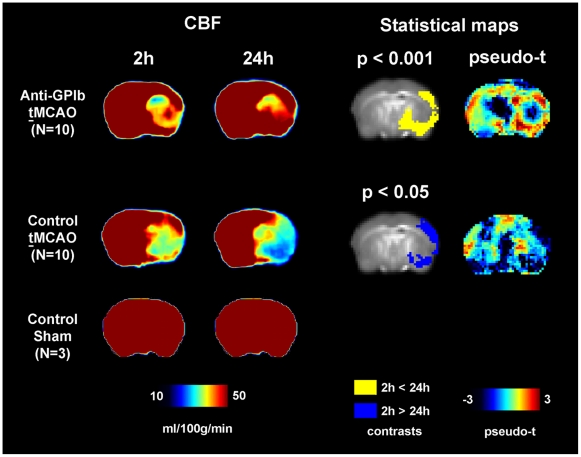
Figure 1. CBF and statistical maps of voxel-wise group comparisons.
Sustained reperfusion is demonstrated by significantly elevated cortical perfusion in anti-GPIb treated mice as compared to persisting severe hypoperfusion in control mice. Color maps of mean CBF are given for each group and time point (left, CBF). The results of voxel-wise statistical analyses of change in CBF over time are shown on the statistical parameter maps (right, Statistical maps). The spatial distribution of significant reperfusion in the anti-GPIb treated group is indicated by the yellow overlay (yellow contrast of 24 h>2 h). The spatial distribution of significant deterioration of hypoperfusion in control mice after tMCAO is indicated by blue overlay (blue contrast of 2 h>24 h).

