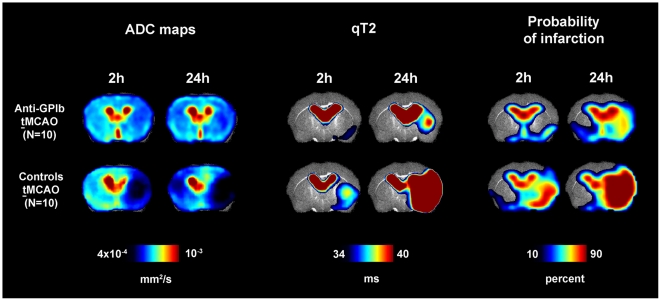
Figure 3. Maps of ADC (left), quantitative T2 (qT2, middle) and probability of infarction (right).
Measures are given as group means per time point. The lower threshold of qT2 was chosen to be the segmentation threshold for infarction (34 ms). Strong protection from cerebral infarction was observed in anti-GPIb treated mice reflected by a substantially lower probability of completed infarction as evident on ADC, qT2 and probability maps (upper row, anti-GPIb). This finding was most marked in the cortex of the MCA territory. In control mice after tMCAO, cerebral infarction involved the cortex in the center of the MCA territory and the complete deep MCA territory with high probability (lower row, controls tMCAO).

