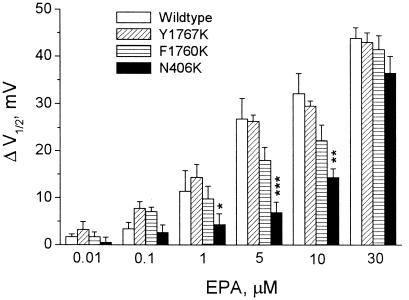
Figure 4.
Effects of EPA on the shift of the steady-state inactivation of INa. Currents were elicited by 10-ms test pulses to 30 mV following 500-ms conditional prepulses varying from −160 mV to −20 mV with 10-mV increments. The experimental protocol was the same as shown for the Inset of Fig. 6B. The membrane potential was held at −150 mV, and the pulse rate was 0.1 Hz. Normalized steady-state inactivation was averaged and fit with a Boltzmann equation. The values of V1/2 voltages were calculated in the absence and presence of EPA. Delta changes of hyperpolarizing shift of V1/2 caused by various concentrations of EPA were plotted for the wild type, Y1767K, F1760K, and N406K of hH1α Na+ channels. Each bar represents the mean and SE of at least eight individual cells. *, P < 0.05; **, P < 0.01; ***, P < 0.001; N406K versus the wild type or the other two mutants, Y1767K and F1760K.

