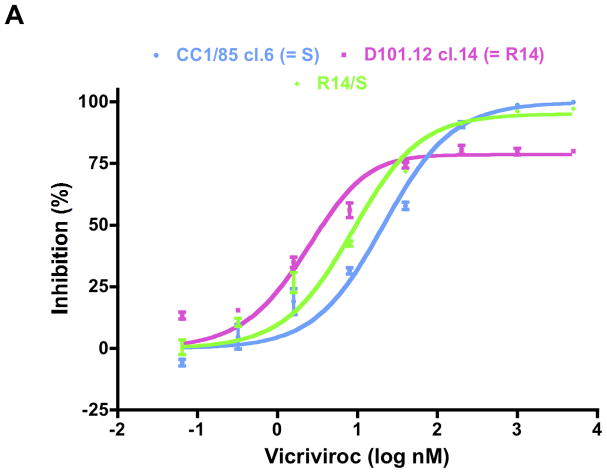
Fig. 5. Determinants of VCV resistance in a TZM-bl cell-based assay.
The same clonal viruses studied in PBMC were assessed for VCV sensitivity in TZM-bl cells with a luciferase reporter gene endpoint. For comparison, the parental inhibitor-sensitive clone S, the engineered R14/S chimera, and the VCV-resistant clone R14 were also tested. For clarity, the dose-response curves are shown in separate panels for the R14/S chimera (A), and for the mutants containing either the V535M change only (B), or the complete set of gp41 changes of Pattern-I (C) or Pattern-II (D). The uncloned isolates were also studied (E). For consistency, VCV-inhibition curves were again created by fitting the model function, Q=(1−(1−(C/(Kdi+C))+w *(C/(4.3*Kdi+C))))*100%, to the average TZM-bl data. The results shown are the average of 3 independent experiments for the mutant clones (Panels A–D) and 2–6 experiments for the isolates (Panel E), with the error bars indicating the SEM.

