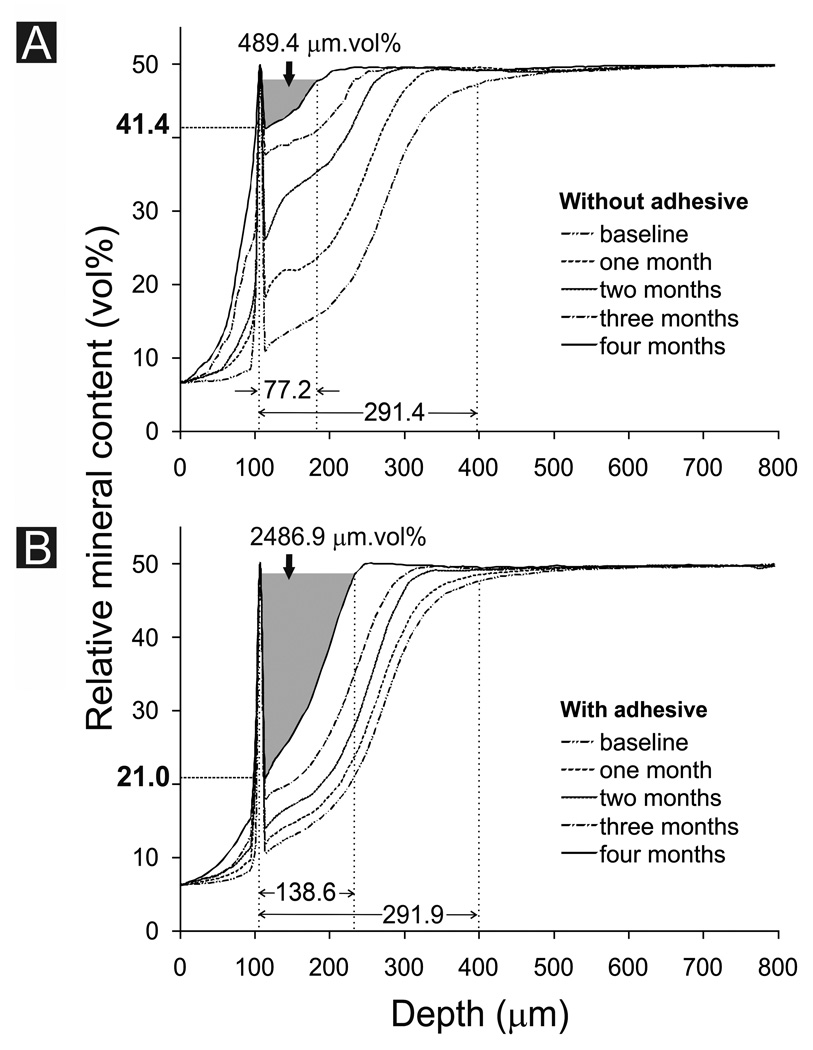
Fig. 2.
Changes in overall mineral profile over time for A. Biomimetic remineralization of unbonded artificial carious lesions. B. Biomimetic remineralization of artificial caries-like dentin lesions that were infiltrated with One-Step adhesive. The ΔZ for the 4th month in each group is highlighted in gray. The relative mineral content along the lesion surface after the 4th month of remineralization is represented by the bold value along the Y-axis (see Table). Mean baseline lesion depth and mean lesion depth after the 4th month of remineralization are indicated by values above the X-axis (see Table).

