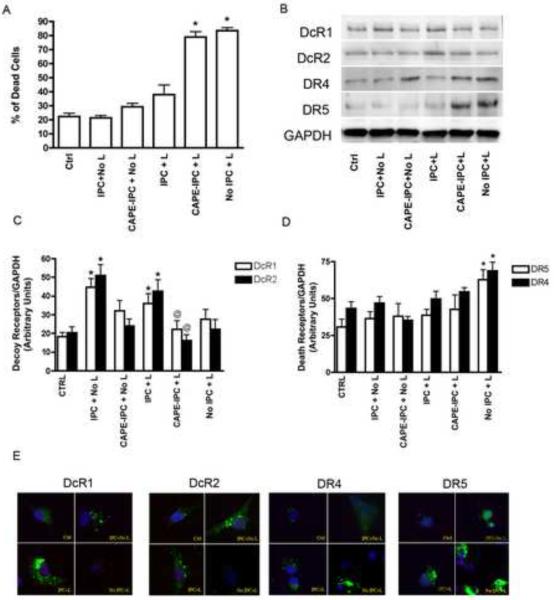
Figure 2. IPC induced expression of decoy receptors inhibited by NFkB inhibition.
Primary neurons underwent IPC with and without NFκB inhibition. A) Trypan blue analysis of neuronal death. * Represents p<0.05 vs IPC+L. B) Representative immunoblot of decoy (DcR1 and DcR2) and death receptor (DR4 and DR5) expression in whole cell lysates from primary neurons. C) and D) Densitometry analysis of decoy and death receptor expression, respectively. In C) * represents p<0.05 vs control, and @ represents p<0.05 vs IPC+L. In D) * represents p<0.05 vs Ctrl, IPC+No L, and IPC+L. E) Immunohistochemistry analysis shows expression of DcR1, DcR2, DR3, and DR4. IPC, ischemic preconditioning; L, lethal ischemia; CAPE, caffeic acid phenyl ester.

