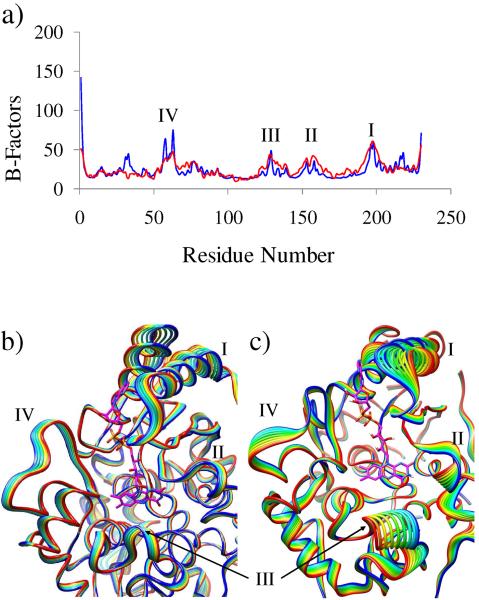
Figure 2.
Functional motion identified through normal mode and MD simulations: a) comparison of the B-factors between X-ray crystallography (red) and NMA-derived normal modes (blue), where all 1–10 low-frequency modes were taken into account to compute the B-factors; b) the lowest frequency normal mode observed for the NQO2; and c) the principal component 1 in the essential dynamics analysis performed using the trajectory of the free energy simulations. In b) and c) only the backbone Cα atoms for 10 conformations are shown for clarity. The four regions that exhibited major thermal fluctuations are I, loop-helix motif (Ala191–Glu217); II, loop (Gly149–Asn161); III, loop (Ala125–Leu137); and IV loop (Ile55 –Phe65).

