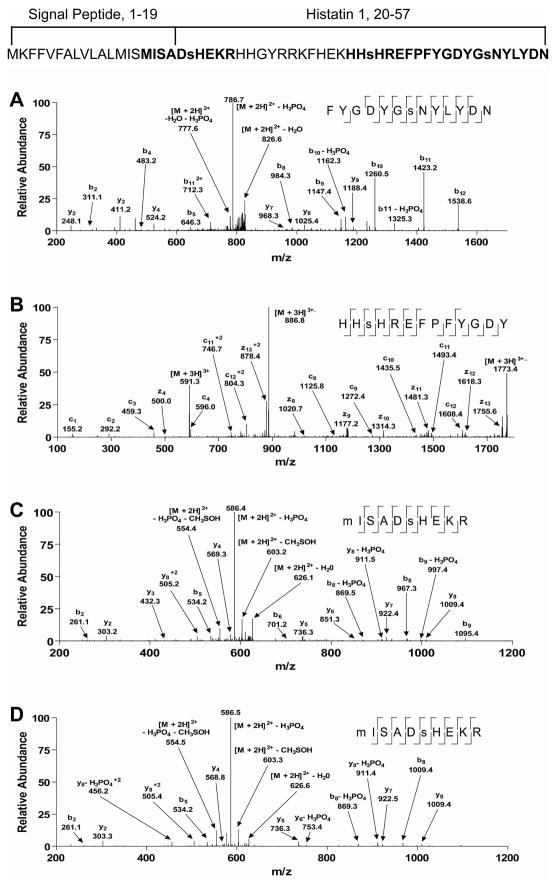
Figure 2.
Representative tandem mass spectra of histatin 1 phosphopeptides. (A) CID spectrum identified as FYGDYGsNYLYDN, where Ser-51 is phosphorylated. (B) ETD spectrum identified as HHsHREFPFYGDY, where Ser-39 is phosphorylated. (C) CID spectrum identified as MISADsHEKR, where Ser-21 is phosphorylated. (D) CID spectrum of a synthesized form of MISADsHEKR for comparison, where Ser-21 is phosphorylated. Also displayed is the full amino acid sequence of the histatin 1 gene product with signal peptide and mature sequences marked. Residues in bold were identified by the spectra from the figure and residues in lower case are identified phosphorylation sites. Also shown at the top of the figure is the complete primary amino acid sequence of histatin 1 including with the signal peptide and mature protein sequence.

