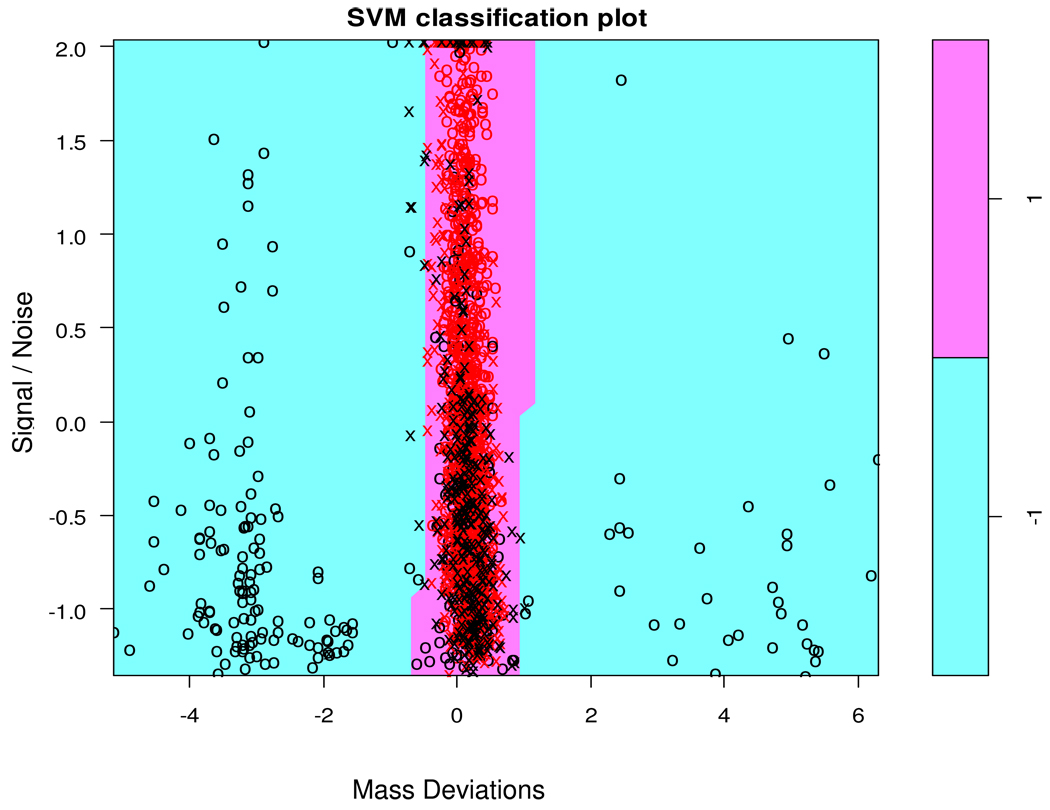
Figure 5.
Separating surface generated by the SVM classifier, projected onto the plane that is parallel to the MassDev and S/N axes and intercepts other seven axes at the median values of the corresponding features. The classifier assigned points from the white region to the positive class, and those from the cyan region – to the negative class. The crosses designated support vectors, i.e., the data points that were used to define the decision boundary. The cyan region contains spectra classified as negative, i.e., those that significantly deviate from the theoretical distributions.

