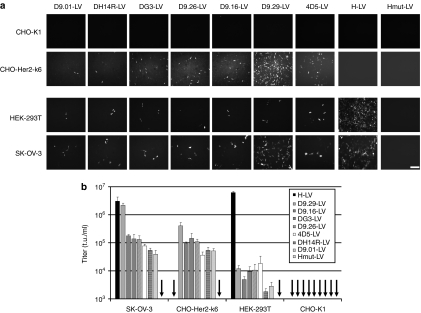
Figure 4.
Selective transduction of HER2/neu positive cell lines. (a) CHO-K1, CHO-Her2-k6, HEK-293T, or SKOV-3 cells were incubated with vector particle supernatant. Transduced cells were visualized by fluorescence microscopy 48 hours after transduction. Scale bar corresponds to 500 µm. (b) The indicated cell lines were transduced with serial dilutions of each vector stock. Titers (t.u./ml) were calculated upon quantification of green fluorescent protein-positive cells by fluorescence-activated cell sorter analysis. Mean values of three independent transduction experiments are presented.

