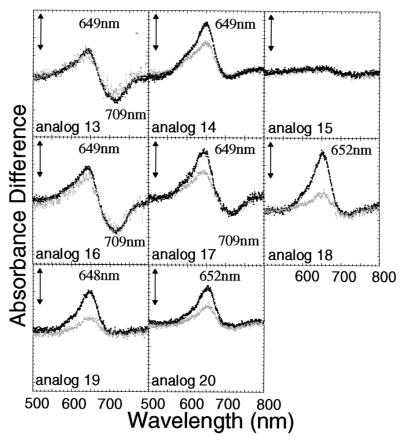
Figure 4.
Difference absorption spectra of the PHYB adduct with PCB analogs having side chain substituents in D-ring (analogs 13–20; see Table 1). The difference spectra were obtained as described in the legend to Fig. 2. Black and gray dotted lines indicate the difference spectra obtained after the first and second cycles, respectively. The vertical bars represent 0.002 absorbance difference units.

