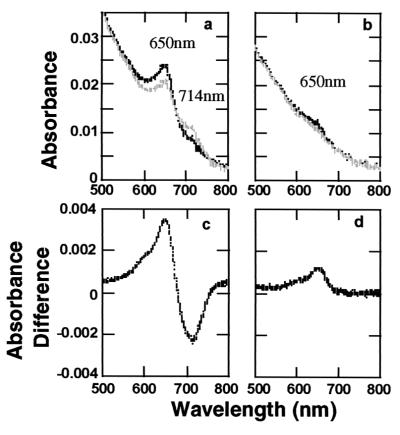
Figure 5.
Absorption and difference spectra of PhyB assembled with PCB and analog 18 when red and far-red light irradiated. The absorption spectra were determined after actinic red and far-red light irradiation. The difference spectra were obtained as described in the legend to Fig. 2. The sample volumes were 250 μl. Total protein concentrations were 0.82 mg/ml for the PCB adduct fraction and 0.37 mg/ml for the analog 18 adduct. Absorption spectra of adducts with PCB (a) and analog 18 (b) are shown (Upper). Black lines represent spectra measured after far-red light irradiation. Gray lines represent spectra after red light irradiation. Far-red/red difference spectra of adducts with PCB (c) and analog 18 (d) are shown (Lower).

