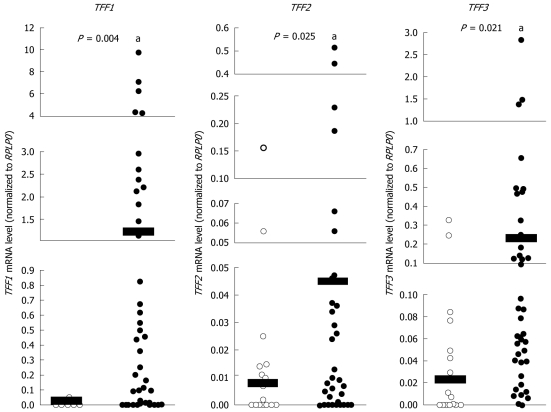
Figure 1.
The mRNA expression levels of Trefoil factor genes in normal and cholangiocarcinoma tissues. Quantitative reverse transcription polymerase chain reaction analysis of trefoil factor (TFF)1, TFF2 and TFF3 mRNA levels in cholangiocarcinoma tumors (n = 46) compared with normal controls (n = 16). Scatter plots show mRNA abundance for each data point normalized to the internal reference gene RPLP0. Horizontal black bars show mean mRNA levels. aP < 0.05. A statistical outlier in the TFF2 normal control data set is +3.58 standard deviations from the mean and failed a Z-test, which requires that values must fall within 3 standard deviations of the mean for statistical validity. This sample (shown in bold font) was excluded from all statistical calculations for this data set.

