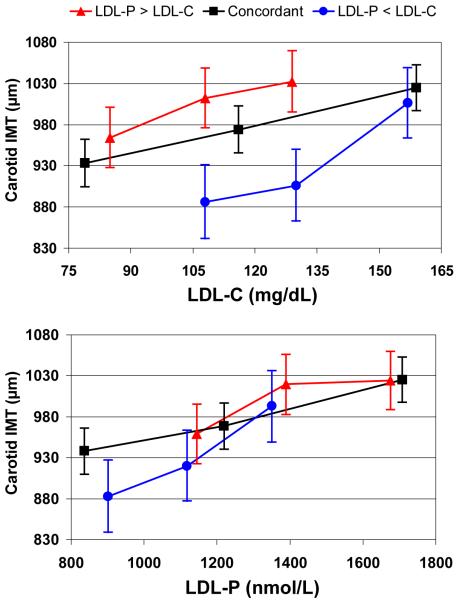
Figure 4.
Carotid IMT in μm by tertile of LDL-C (top) or LDL-P (bottom) in 3 subgroups with concordant or discordant LDL levels. Least squares mean IMT and 95% confidence intervals are from multiple linear regression models adjusted for age, gender, race, systolic blood pressure, hypertension treatment, smoking, body mass index, and diabetes status. Subgroups analyzed: LDL-P > LDL-C discordant; n=1126 ( ), concordant; n=2246 (
 ), LDL-P < LDL-C discordant; n=1127 (
 ).
).

