
Figure A2 (Appendix).
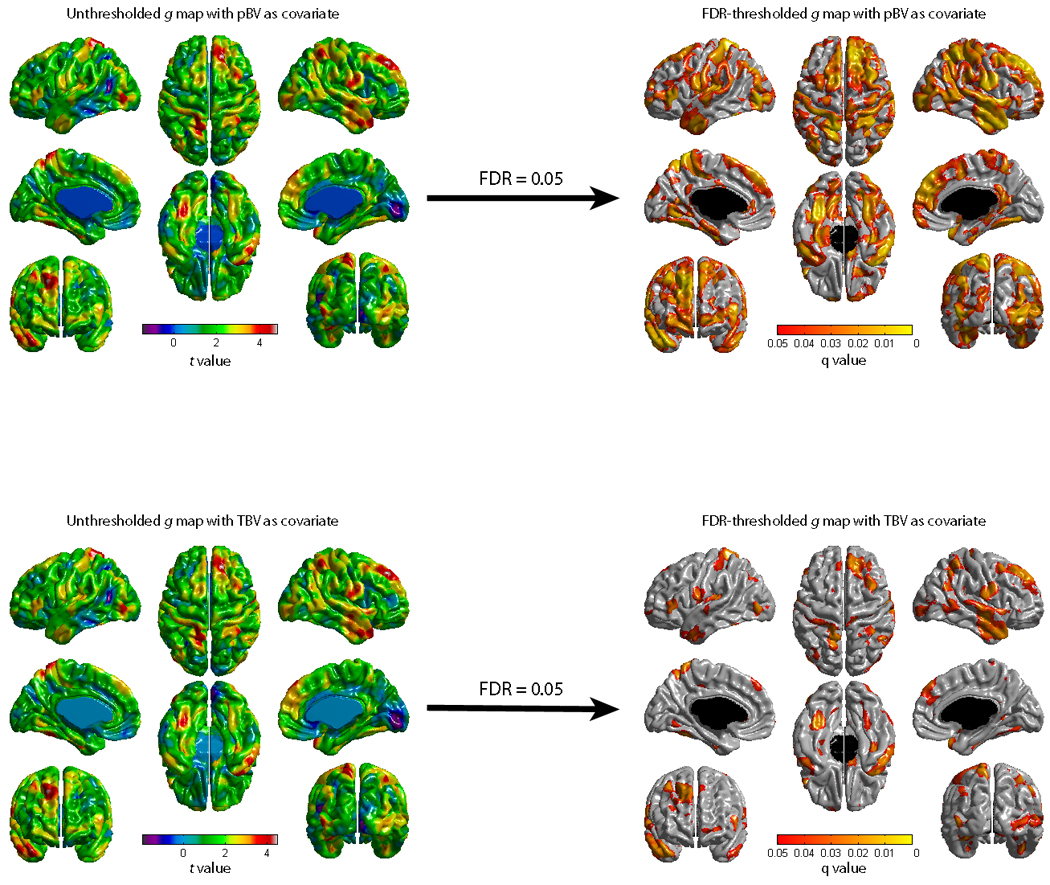
Figures showing the association between g and cortical thickness after controlling for pBV (White Matter + Intracerebral CSF + Subcortical Gray Matter) or TBV (White Matter + Intracerebral CSF + Cortical and Subcortical Gray Matter). The top right g map is identical to Figure 3 and is reproduced here for convenience to facilitate comparisons between figures.