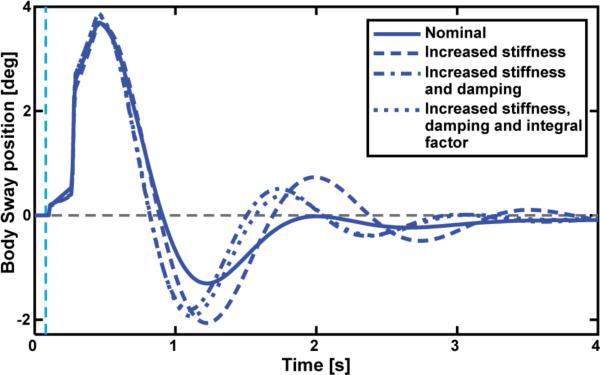
Fig. 7.
Plots of the impulse response of the postural control model for nominal values of stiffness and damping in the young adult population (solid curve), versus increased stiffness only (dashed curve), versus increased stiffness and damping (dash-dot curve), and versus increased stiffness, damping, and integral gain (dotted curve). Note that peak-to-peak oscillations are greatest for increased stiffness alone, and that increasing damping concurrent with an increase in stiffness diminishes these oscillations. Increasing the integral gain has little effect compared to increased stiffness and damping.

