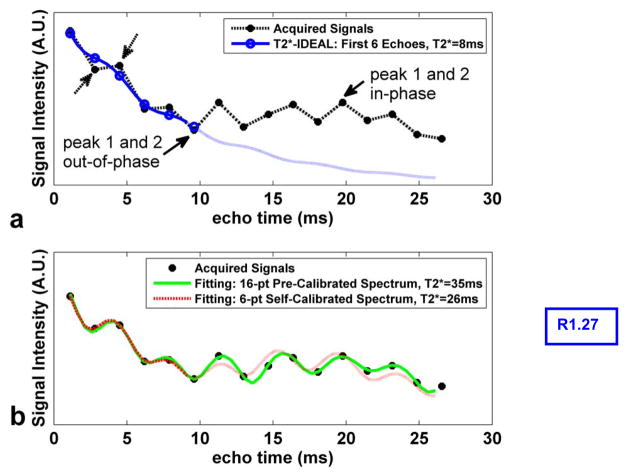
Figure 2.
Illustration of the confounding effect from the fat spectra peaks when estimating R2* in fatty tissues (a) and the excellent fitting from the multipeak corrected T2*-IDEAL (b). Sixteen echoes were acquired in a peanut oil phantom and the magnitude signals of a representative pixel are shown (dotted black line). When using the conventional T2*-IDEAL on the first six echoes (solid blue curve in a), an over-estimated R2* resulted (T2* = 8ms) primarily due to the signal modulation from fat peak 2 (solid arrows). The high frequency oscillation indicated by the dashed arrows comes from the presence of the fat peak 3. As part of the spectrum pre-calibration procedure, when treating fat peaks as six independent species using 16-echo T2*-IDEAL, the re-synthesized signals fit the acquired signals extremely well (solid green curve in b). The self-calibrated spectrum using the first six echoes (dashed red curve in b) also leads to an excellent fit to the acquired signals, particularly at the first six echoes.

