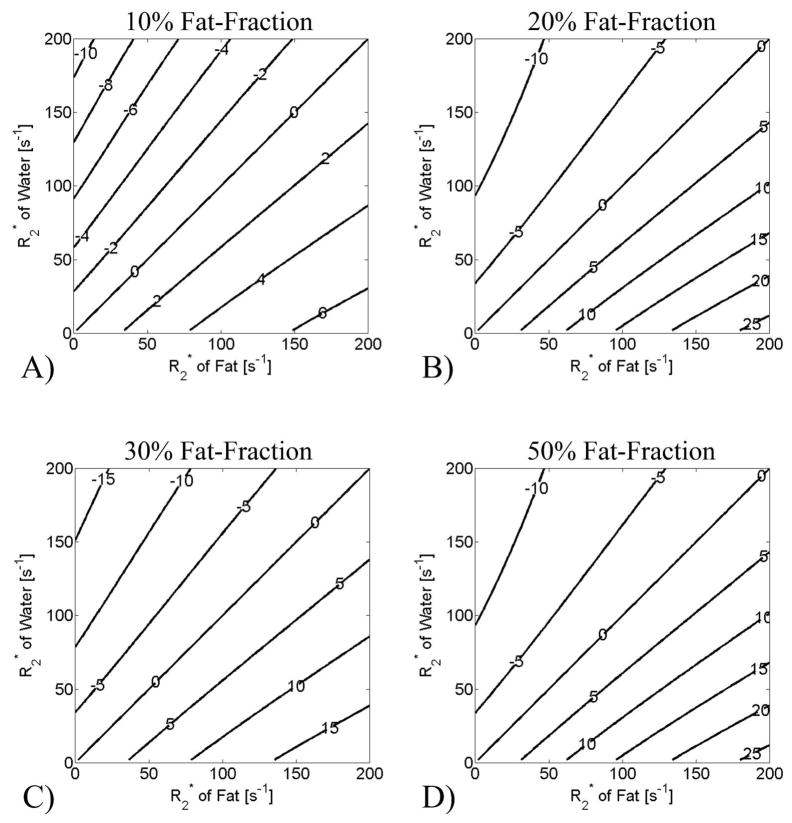
Figure 2.
Simulations of the percentage error in measured fat-fraction when using single T2* correction with 6-point IDEAL to reconstruct data where the T2* of fat and water is different. Different fat-fractions were simulated: a) 10%, b) 20%, c) 30% and d) 50%. 0% fat-fraction is not shown because single T2* methods generate no error for this case. The labels on the contour plots show the absolute percentage errors in fat-fraction estimation. The error in the apparent fat-fraction is zero along the diagonal of the contour plots, because the single T2* correction method accurately removes the error caused by T2* decay. Relatively large errors, however, can occur when T2* of water and fat are not equal, particularly at higher fat-fraction and shorter T2* values (longer R2*).

