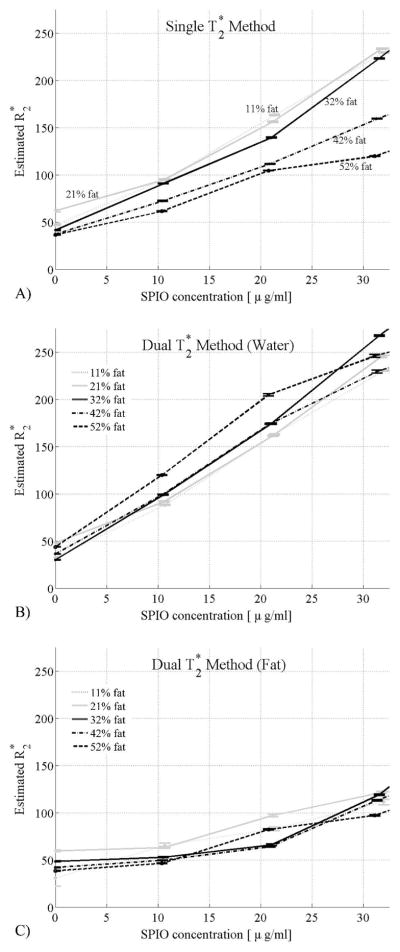
Figure 6.
Estimated R2* values from single T2* correction method (a) and the dual T2* correction method (b, c) at increasing SPIO concentrations and different fat-fractions. Error bars show the standard error of the mean. With the single T2* correction method, the estimated values of R2* increase as SPIO concentrations increase, and there is a strong dependence of the estimated R2* with fat-fraction. Using the dual T2* correction method, the R2* of water is more strongly affected by increasing concentrations of SPIO. Interestingly, there is relatively minimal dependence of the estimated R2* values on fat-fraction using the dual T2* method. These findings suggest that the dual T2* method more accurately reflects the signal behavior of the fat/water/SPIO phantom.

