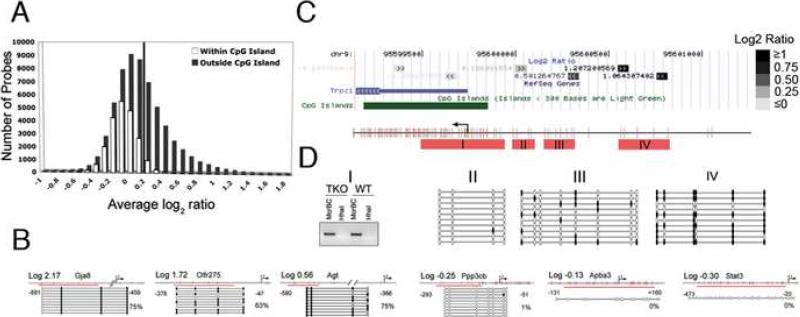
Figure 1. Using mDIP-CHIP Assay to Profile the Promoter Methylation Pattern in Wild Type mESCs.
(A) All probes for the array are classified as either inside or within 50bp of a CpG island (white) or outside a CpG island (grey) and then grouped by their average log2 ratio. The solid line is placed at log2 ratio of +0.2 value to annotate the proportion of methylated gene promoters. (B) Using the average Log2 ratio, we selected 3 genes thought to be methylated as well as 3 that were thought to be unmethylated. For the bisulfite confirmation, each line represents an individual clone and each circle represents a CpG dinucleotide. The red line indicates the region we analyzed. Filled circles are methylated CpGs and open circles are unmethylated. (C) The average signals (Log2 ratio) for each probe (block with double arrowheads) in the promoter region are plotted in the UCSC genome browser – here we take the Trpc1 gene as an example. Note the dark probes annotate probes with high Log2 ratios whereas light color probes represent probes with low or negative Log2 ratios. (D) The confirmation of methylation status for the probes in the Trpc1 gene either inside or outside of a CpG island. Red bars (I-IV) indicate regions analyzed. Region I shows a gel picture of a McrBC-HhaI genomic PCR, indicating the unmethylated state of the CpG island of the Trpc1 transcription start site. II-IV show bisulfite genomic sequencing results of methylated probes upstream of the CpG islands, indicating a gradient of methylation towards the probes with high log2 ratios (filled dots are methylated CpG sites).

