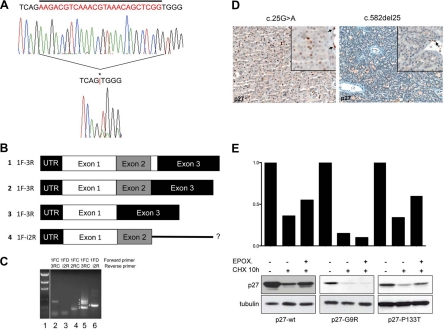
Fig. 1.
In vivo and in vitro analyses of CDKN1B mutants. A, Twenty-five base pair somatic deletion mutation identified in patient 4 (c.582del25). The top electropherogram shows the germline sequence, while the bottom electropherogram shows the tumor sequence. Sequence deleted in the tumor is indicated by a bar above the germline sequence, and the position of the mutation in the tumor sequence is indicated by an asterisk (*) and a red bar between the nucleotides flanking the deletion. The presence of clear DNA sequence downstream of the deletion, unaccompanied by overlying sequence in the normal (or other) reading frame, indicates the singular presence of the mutant allele, consistent with LOH. LOH of CDKN1B and the surrounding region in this case was also observed in comparative genomic hybridization and single nucleotide polymorphism array analyses (Supplemental Refs. 1 and 2). B, Schematic of the CDKN1B transcripts obtained by RT-PCR. Numbers 1 to 4 indicate the bands in the gel in C. Sequences of bands 1 and 2 (corresponding to lane 5 in C) were consistent with normal splicing (exon 1 to exon 2 to exon 3), the larger band 1 (350 bp) representing full-length exon 2 (line 1), likely from rare admixed normal nonparathyroid cells, and the smaller band 2 (325 bp) being exon 2 with a 25-bp deletion (line 2). Sequence analysis of band 3 (212 bp) revealed a novel isoform of p27 mRNA resulting from splicing of exon 1 directly to exon 3, skipping exon 2 (line 3). A third novel isoform of p27 was detected, corresponding to band 4 (292 bp) in C. Sequence analysis of this band was consistent with splicing of exon 1 to exon 2 with continuation into intron 2 rather than splicing to exon 3 (line 4). C, RT-PCR for p27 in normal control from placenta (lanes 2 and 3) and tumor 4 (lanes 4, 5, and 6). Forward and reverse primers used for reaction are listed above each lane. The presence of p27 mRNA was confirmed in control (lane 2) by using a forward primer in exon 1 and a reverse primer in exon 3 and in tumor (lane 4) by using a forward primer in exon 1 and a reverse primer in exon 2. Using a forward primer in exon 1 and a reverse primer in exon 3, three distinct bands were detected in the tumor sample (lane 5), while only one was present in the control (lane 2). An additional novel isoform of p27 was detected in tumor 4 using a primer in exon 1 and a primer in intron 2 (lane 6), which was absent in the control (lane 3); because the primer combination also spanned intron 1, this band was distinguishable from genomic DNA based on size. Samples included in this study were grossly dissected before RNA extraction; as such, the presence of wt p27 message in this sample was likely attributable to contamination by normal stroma, confirmed by positive p27 staining of adjacent endothelial cells. Despite the presence of mRNA, no normal p27 protein was detected in tumor cells by IHC (D, right). D, Tumor tissues from two individuals were available for immunohistochemical analysis. Left, p27 immunohistochemical staining of the parathyroid adenoma of patient 1 (bearing the c.25G>A mutation). Less than 20% of tumor cells (×200) demonstrate expression of p27. Right, p27 staining of the parathyroid adenoma of patient 4 (bearing the c.582del25 mutation) shows no p27 immunoreactivity in the tumor cells (×200), which can be better appreciated in the inset (×400). Normal endothelial cells strongly positive for p27 serve as internal control (arrows). E, Turnover of p27-wt and of p27-G9R and p27-P133T proteins was measured in cells after CHX treatment with and without the proteasome inhibitor epoxomycin. Immunoblotting was done with the indicated antibodies. p27-wt and p27-P133T have a half-life of approximately 10 h in GH3 cells; epoxomycin partially blocks p27-wt and p27-P133T degradation but not p27-G9R degradation (lower section). Thus, the instability of p27-G9R appears to be attributable in large part to proteasome-independent mechanisms. The histograms above show the band intensities normalized against α-tubulin loading controls.

