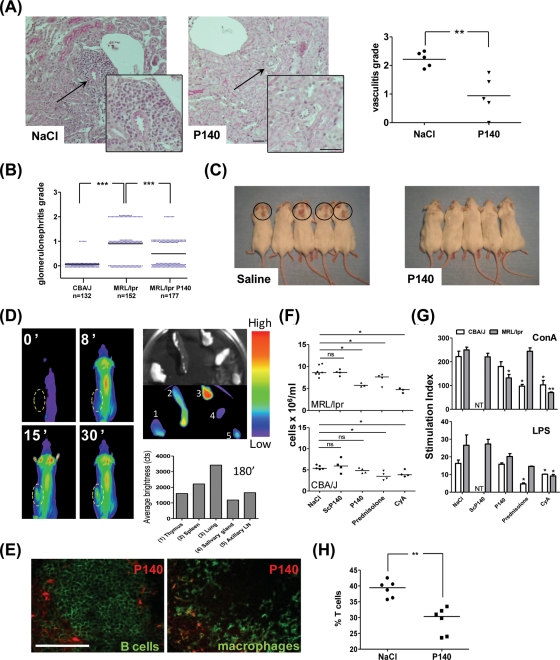
Figure 1.
In vivo effect and biodistribution of P140 peptide in MRL/lpr mice. (A, B) MRL/lpr mice received saline alone or 100 µg P140 peptide/injection/mouse on four occasions. Kidneys were collected from 25-week-old MRL/lpr mice and fixed in formalin. Haematoxylin and eosin-stained kidney paraffin sections were scored for (A) vasculitis (n=5/group; p=0.0046 between the two groups) and (B) glomerulonephritis grade (five mice/group, corresponding to 132–177 glomeruli). (C) Observation of skin lesions in both groups of 16-week-old mice. (D) In vivo biodistribution of Alexa Fluor633-labelled P140 peptide following retro-orbital injection of 100 µg peptide in NaCl (complete data in online supplementary figure S1). The yellow circle designates the position of the spleen. At the end of the experiment (180 min), organs were collected and fluorescence was measured in the isolated organs (1, thymus; 2, spleen; 3, lung; 4, salivary gland; 5, axillary lymph node). (E) Spleen sections were co-stained with antibodies to B220 and MOMA-1/CD169 to identify B cells and marginal zone metallophilic macrophages, respectively. (F) Peripheral blood lymphocyte (PBL) counts measured in 10-week-old MRL/lpr and CBA/J mice (n=3–4 mice tested individually/group) that received at daily intervals 10 intraperitoneal injections of P140 (100 µg/mouse), ScP140 (100 µg/mouse), ciclosporin A (20 mg/kg) or saline or that received prednisolone orally at a 4 mg/kg dose. (G) Effect of P140 overdosage on the ability of PBLs to respond to T- and B-cell mitogens. Cultures for 48 h in the presence of 3 µg/ml concanavalin A (ConA) or 5 µg/ml; lipopolysaccharide (LPS). NT, not tested. (H) P140 peptide administration reduces the percentage of total CD3 T cells among splenocytes. Splenocytes from 6-week-old MRL/lpr mice were collected 3 days after a single intraperitoneal injection of 200 µg P140 or saline (n=6/group). Representative results of two independent experiments are shown. *p<0.05, **p<0.01, ***p<0.001. NS, not significant (Mann–Whitney U test in panels A, B, F and H; Student t test in panel G). Bars, 100 µm.

