Figure 2.
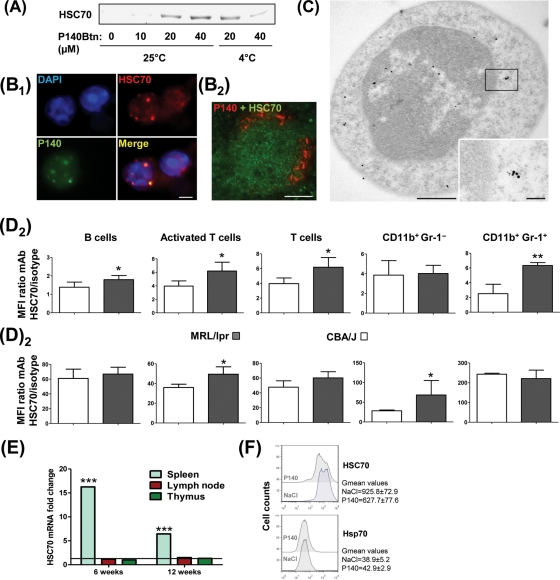
P140 peptide interacts with HSC70 and, in vivo, diminishes HSC70 overexpression in MRL/lpr lymphocytes. (A) Pull-down experiments showing the interaction of P140 peptide with HSC70 at 25°C and 4°C (representative results of five independent experiments). (B1) Co-localisation in permeabilised MRL/lpr dissociated splenocytes of P140 peptide and HSC70 examined 1 h after retro-orbital injection of 100 µg Alexa Fluor488-labelled P140 in NaCl. (B2) Co-localisation of P140 and HSC70 on spleen sections from MRL/lpr mice that received intravenously 200 µg rhodamine-labelled P140. (C) Co-localisation of P140 and HSC70 staining shown by immunoelectron microscopy (example with a single cell). HSC70, 15 nm gold particles; P140, 6 nm gold particles. (D) Fluorescence activated cell sorting analysis showing HSC70 expression at the surface of (D1) or intracellularly (D2) in different spleen cell subsets from CBA/J and 12-week-old MRL/lpr mice (n=5): B cells (B220+CD3), activated T cells included double negative T cells (B220+CD3), naïve T cells (B220–CD3), granulocytes/macrophages (CD11b+Gr-1+). HSC70 levels were expressed as the mean fluorescence intensity (MFI) for specific antibody/MFI for isotype-matched control antibody (Ab) ratio. Error bars represent SD. Representative results of at least two independent experiments. (E) Levels of HSC70 mRNA detected by qRT-PCR in lymph node, splenic and thymic cells from 6- and 12-week-old MRL/lpr mice compared with CBA/J mice. Mean of two experiments in triplicate, normalised to actin-β expression. (F) Intracellular staining of HSC70 and Hsp70 in splenic B cells collected from untreated or P140-treated (six times at daily intervals; 100 µg/injection/mouse) 6-week-old female MRL/lpr mice. *p<0.05, **p<0.01, ***p<0.001 (Student t test). Bars = 100 µm, except in (C) where bars = 500 and 100 nm in the picture and inset, respectively.

