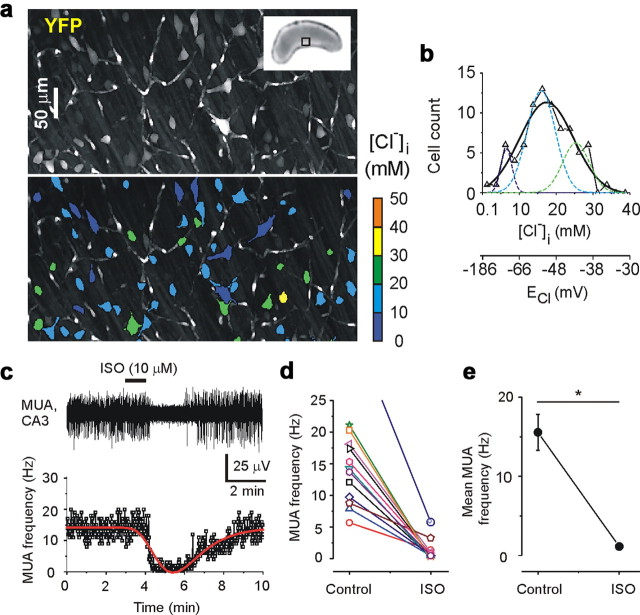
Figure 1.
Distribution of resting [Cl−]i and GABA action in the intact neonatal hippocampus. a, Two-photon fluorescence confocal scanning images of the CA3 pyramidal cell layer in the intact hippocampus in vitro of the neonatal (P7) transgenic CLM-1 mouse expressing Clomeleon. Top, Overlay of confocal multiple planes (150 samples; 2 μm step) of the Cl−-sensitive YFP signals of the CA3 neurons. Inset shows the photograph of the intact hippocampus. Bottom, Pseudocolored regions of interest from neurons according to [Cl−]i. b, Distribution of resting [Cl−]i (bin size, 2.5 mm) from 81 individual neurons shown in a. A Gaussian fit yielded a peak at 17.4 ± 0.6 mm and width of 14.6 ± 2.3 mm. Multipeak fit yielded three peaks at 6.5 ± 0.6, 15.9 ± 1, and 25.3 ± 2.1 mm. c–e, Effect of isoguvacine (ISO) on MUA in the intact neonatal (P5–P7) hippocampal preparations. c, Extracellular recording of MUA in the CA3 pyramidal cell layer and corresponding frequency of MUA. Bath application of isoguvacine (10 μm) caused a transient decrease in the frequency of MUA; peak function fit is indicated by red line. d, e, Individual hippocampus responses to isoguvacine and corresponding mean frequency of MUA (*p = 0.00002, two sample t test). Decrease in MUA frequency indicates that the net effect of GABAA-R activation was inhibitory.

