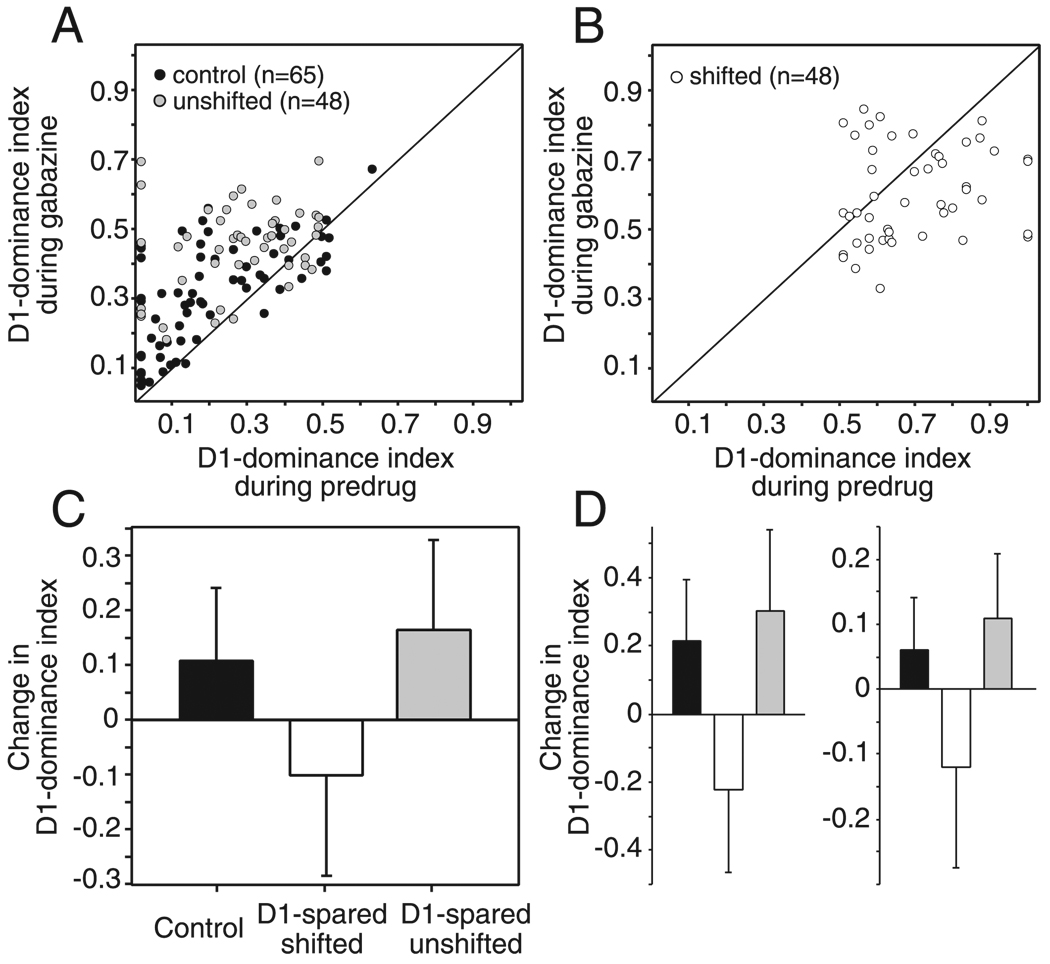
FIG. 5.
Quantification of gabazine’s effect using D1 dominance index (D1-di). A and B: effect of gabazine on D1-di for control, unshifted (A) and shifted (B) units. Points above the diagonal indicate that gabazine increased the D1-di and thus preferentially disinhibited D1 (surround) whisker responses. Points below the diagonal indicate that gabazine decreased the D1-di and thus preferentially disinhibited D2 (principal) whisker responses. C: mean change in the D1-di across all control, shifted, and unshifted units. Bars are SD. D: mean change in the D1-dominance index for 20% of units in each group with the strongest (left) and weakest (right) predrug responses. Changes in the index are significant for all groups (1-tailed Wilcoxon). Bars are SD.

