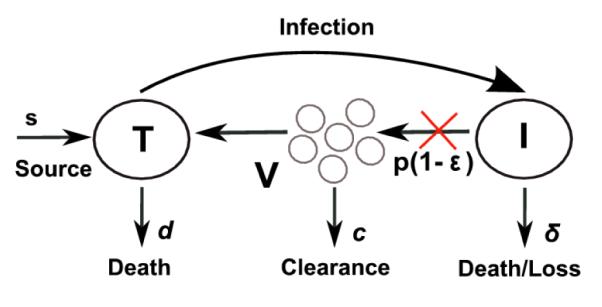
Figure 1.

Schematic representation of the standard model (upper left), the extended model with cell proliferation (upper right) and the model with two strains of virus (bottom). The red and green X’s indicate steps in the viral lifecycle where IFN or DAAs interfere with virus production. The symbols are defined in the text.
